Click on the relevant box below to jump to that opportunity.
|
Characterization of silica sand deposits |
Establishing a silica beneficiation plant |
Silica sand for glassmaking |
|
Silica sand for finely ground and speciality silica |
Establishing a silicon metal smelter |
Opportunities in high purity quartz |

– Click on this icon in the top right corner of the page to return to this page.
Characterization of silica sand deposits
Background
Global scouting work uncovered a very large range of downstream applications for silica sand. However, local scouting showed that the Omani silica sand industry is nascent, limited to quarrying of sandstone that is crushed for use in aggregate. Omani silica is not currently used for other and potentially higher value applications.
Omani interviewees commented that Oman has extensive deposits of silica but that these have not been characterized in detail. Characterization is essential to understand Oman’s potential for creating greater value. To capitalize fully on characterized resources, information about the resources must be made accessible to potential investors.
This section summarizes the approach recommended for characterizing silica sand deposits. Experts were unable to recommend a published source that describes characterization processes and hence the recommendations here are collated from multiple sources. The recommendations should be treated as an indicative guide to the actions required, as the details of processes needed will depend on sand types and intended applications.
Omani silica is also found as quartz formations. Characterization and applications of high-purity quartz are discussed in Section 19.
Quality criteria
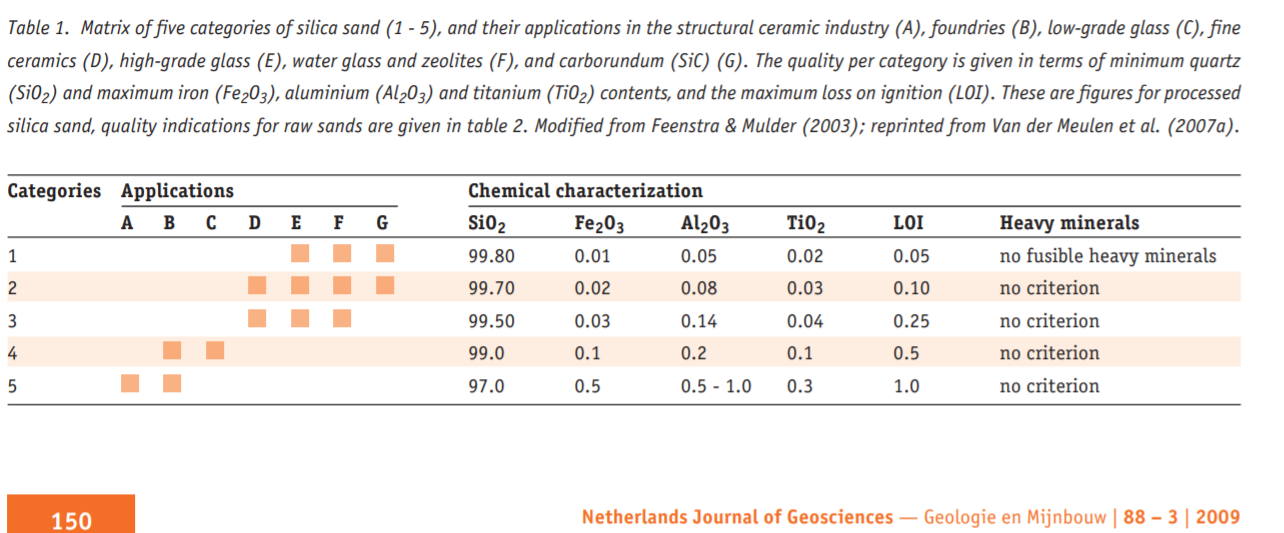
Table 14‑1 shows the quality indication for wet-screened raw silica sand, based on common practice among Dutch silica sand producers. Table 14‑2 provides a top-level guide to downstream application based on the quality determined.
Table 14‑1. Quality indications for wet-screened raw silica sand (LOI: loss on ignition)1
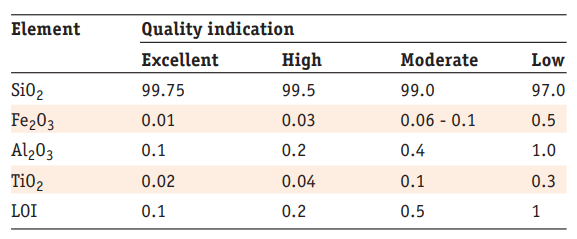
Table 14‑2. Possible applications of silica sand based on purity
Resource assessment
Overview
Figure 14‑1 summarizes the overall process of resource assessment for silica sand and the following sections provide further detail1.
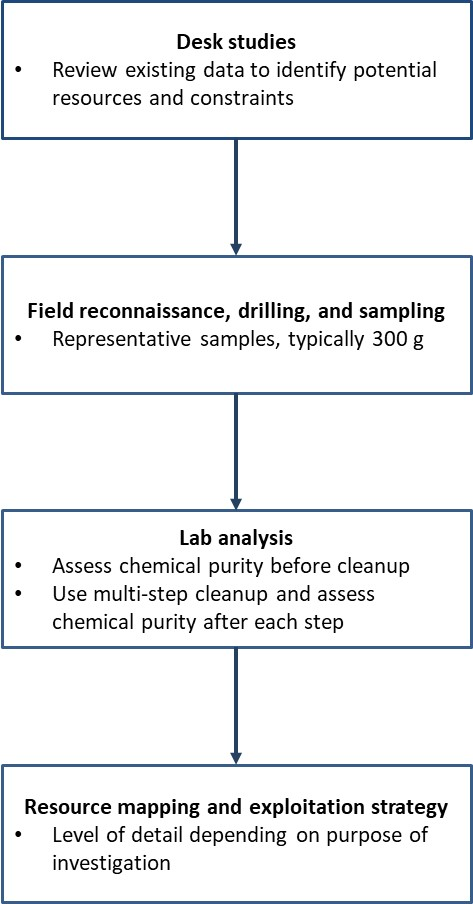
Figure 14‑1. Overview of resource assessment for silica sand
Desk studies
The first stage of a reconnaissance survey is to review the following:
-
Existing information about the resource available in geological maps and reports (digital maps exist for Oman, but the detail may be limited);
-
All constraints associated with extraction of the resource, including land allocated for building, or other purposes such as military training grounds or oil wells, as well as natural protected areas such as the oryx sanctuary in central Oman;
-
The expected ease of extraction in each location;
-
The proximity of the resource to where it is needed, which is especially important for a bulk commodity such as silica sand.
These aspects are considered in combination to generate priorities for field work. Often trade-offs may be needed, for example whether to prioritize a high-quality but geographically distant resource over a lower quality but conveniently located resource, and the decision will depend on desired end applications and the quality of the sand required.
Omani deposits
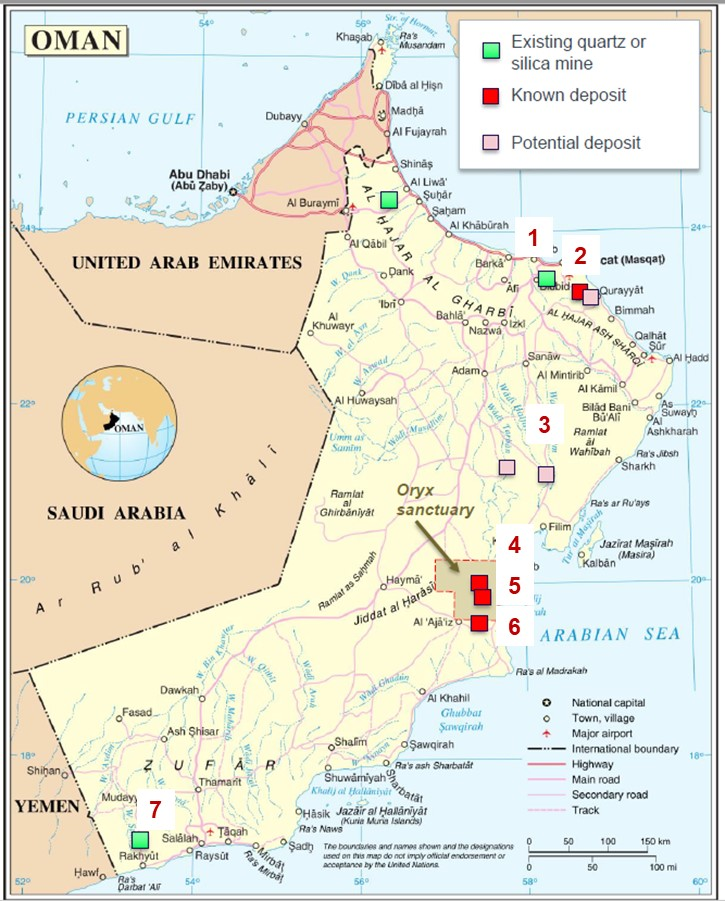
Figure 14‑2 and Table 14‑3 summarize available information on Omani silica deposits. Note that three high-quality deposits are in a highly fragile natural landscape that is a designated oryx sanctuary, and this may limit their exploitation.
|
Area |
Estimated reserves |
Estimated SiO2 % |
Possible downstream uses |
|
|
1 |
Warah / Hawasina Formation |
Large, medium-quality silica deposits Multicoloured quartz as high-silica supplement in Al Awabi / Ar Rusayl cement quarry |
Lower quality |
Low quality silica sand Gemstone potential |
|
2 |
Saih Hatat area / Salil |
Quartzite deposit, estimated 5-10 mt |
>98% |
Suitable for silicon production |
|
3 |
Hawshi |
Jaspilite (hydrothermal quartz) with high silica content, 0.5 m wide, possible extraction as by-product of kaolin mine |
Lower quality |
|
|
4 |
Ar-Raqi |
Silica sand, 0.7-1.4 mt |
>98%/ variable 96.4% – 99.92 |
More sampling needed |
|
5 |
Abu Tan |
Silica sand, 6.4-10 mt |
>98%/ average 96.4% (different estimates from |
Economic study suggests low to medium quality silica sand but more sampling needed |
|
6 |
Wadi Baw |
Silica sand, 1.8-4.17 mt |
>98%/ average 96.4% |
|
|
7 |
Hawf |
Silica sand/friable sandstone deposit, 15×15 km, estimated 5 to 10 million tonnes |
>98% |
Field reconnaissance, drilling, and sampling
Field reconnaissance work is conducted to confirm or refine the priorities suggested by the initial desk work. Based on work done in Saudi Arabia, the following approach is recommended for initial mapping in Oman1:
-
All existing information should be collated and used to select areas of 1 km x 1 km sandstone for sampling.
-
A topographic survey is conducted to select locations to dig trenches for sampling. Areas of 5m x 2m x 3m are selected for sampling, a trench is dug at each corner, and samples of 300 kg are collected from each trench.
-
Samples are inspected with a hand lens. Ideally, quartz grains must not have inclusions or contaminants. However, naturally occurring clean, clear, well-sorted monomineralic quartz sands that do not need processing are rare, and sand is usually washed to improve its purity2. Preliminary assessment of particle shape can be made in the field, e.g. round, angular, spherical, platy (flaky), or acicular (needle-shaped).
-
The bulk samples are sent for laboratory analysis.
Laboratory analysis
The critical factors in defining a sand or sandstone deposit as a silica sand resource are the inherent particle size and the ease with which impurities can be removed, together with the level of losses incurred in this process1. To this end, samples are analysed both before and after clean-up, with the key consideration being the purity that can be obtained after clean-up. This must be measured empirically: although surface contaminants can be efficiently removed by washing, if contaminants such as iron are bound in the crystal lattice structure of the silica, they cannot be removed.
Clean-up involves a selection of the following techniques, depending on levels of contamination and expected end-uses of the material2:
-
Attrition scrubbing: Removes iron coating from grains
-
Froth flotation: Removes mica and feldspar
-
High intensity magnetic separation: Removes iron-bearing impurities
-
Gravity separation: Removes heavy iron-bearing minerals and chromite
-
Size classification (hydrocyloning and elutriation): Removes coarse and very fine fractions
Note that acid leaching has been used to remove iron oxide and other minerals but its use has decreased substantially because the technique is energy intensive and leads to environmental issues.
Before and after clean-up, the following parameters are assessed (with some variation depending on intended application):
-
Colour: Pale sand is likely to have a high silica content. Brown or orange colouration indicates iron contamination. This is often easily removed by washing or magnetic separation, and hence highly coloured sand should not be disregarded as it may have significant industrial potential once it has been washed.
-
Chemical analysis: Purity is assessed as shares of oxide3. Testing is usually carried out by X-ray fluorescence and inductively coupled plasma (ICP) analysis to measure chemical content. The most important contaminants are:
-
Iron (Fe2O3), typically related to limonite and goethite grain coatings, and possibly to glauconite;
-
Aluminium (Al2O3), mainly from clay minerals such as glauconite and feldspar;
-
Titanium (TiO2), indicative of rutile or ilmenite;
-
There may also be value in assessing the content of chromium (Cr2O3) and heavy minerals for some end applications.
-
Particle size analysis: Particle size is measured and sand can be sieved to provide the size range required for specific applications.
-
Particle shape analysis: Roundness and sphericity are important parameters for fracking applications and are often determined by petrographic analysis (analysis of thin slices of material using a binocular microscope) 4.
-
Mineralogical composition: Assessed by X-ray diffraction analysis, to measure contaminants such as clay, feldspar, calcite, mica, dust, organic matter, etc.
-
Heavy metal content: assessed by heavy media separation, including testing for refractory minerals (i.e. those that melt only at high temperatures and hence can contaminate glassmaking processes), e.g. zircon, chromite, corundum, kyanite, sillimanite, andalusite etc.
Resource mapping
The final stage in a reconnaissance survey is to compile a resource map. A scale of 1:100,000 or even 1:200,000 may be used for reconnaissance surveys of large areas, but a scale of 1:50,000 is usually recommended, and interviewees during local scouting emphasized that Oman needs to carry out mapping at this scale. Reconnaissance maps illustrate the general variation in resource quality and may also show topographic information, underlying geology, and sample points, as well as administrative and legislative boundaries, extraction licences, and transportation routes.
Information from reconnaissance surveys is used by explorers to assess the potential of an area. Companies are likely to need to carry out more detailed resource assessments on specific areas, which include mapping to a higher scale, up to 1:10,000. The most detailed assessments of resources or reserves identify and quantify the resource or reserve and all constraints (physical, environmental, legal, administrative, economic, etc.) on development.
Case study: Ad Doghm, Saudi Arabia
Figure 14‑3 shows an example from Ad Doghm, Saudi Arabia, showing the average chemical composition of silica sand after washing, and compares the chemical composition of three samples regarding the levels of silica and key contaminants before and after washing1.
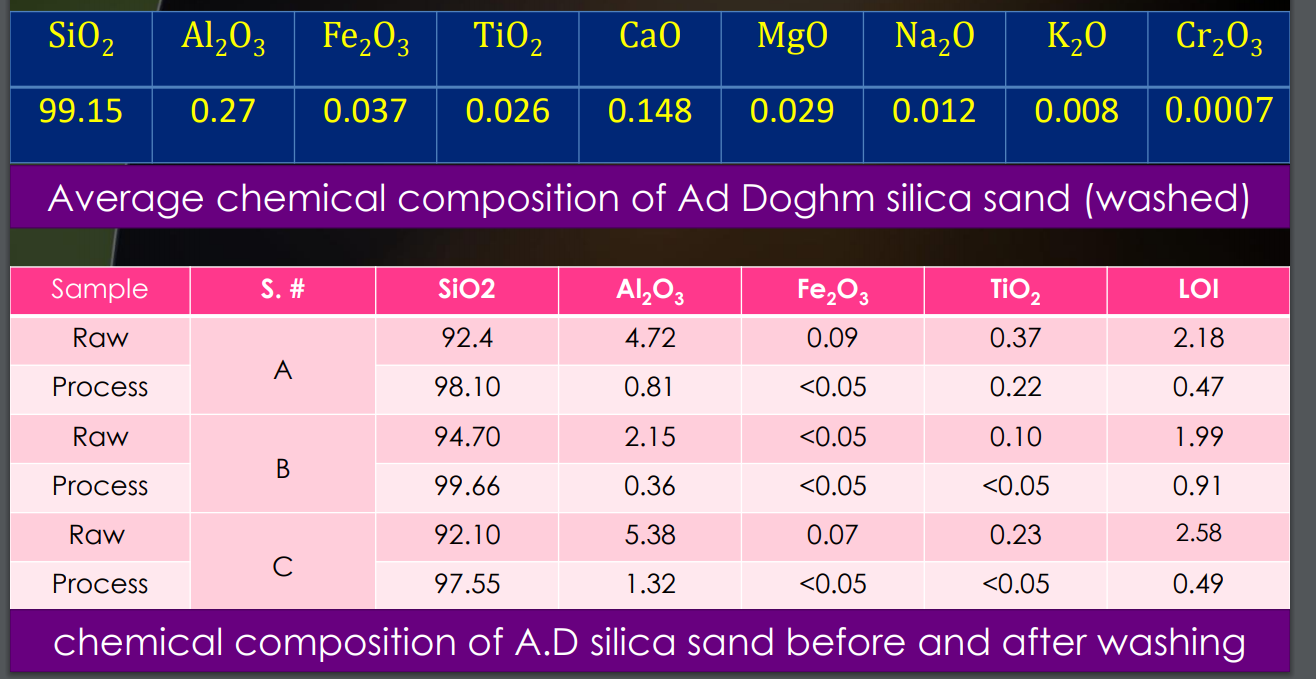
Figure 14‑3. Chemical composition of silica sand in samples taken from Ad Doghm, Saudi Arabia
Next steps
The data available on purity of Omani silica sand deposits are limited. Such studies need to be undertaken to establish possible uses of Omani silica sand. MDO in Oman is likely to have the knowledge and expertise needed to initiate this work.
LIST OF OPPORTUNITIES
All opportunities are listed below in their respective clusters. Click on each opportunity to find out more.